Windstream (WIN)

  Background

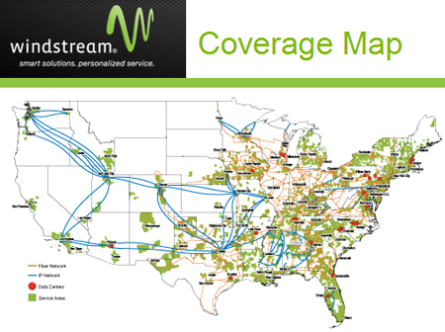
Windstream (WIN) is a 5 billion dollar telecom based in Little Rock, Arkansas.  Windstream is a rural focused ILEC, which means it is an incumbent provider of telecom services. Originally, the company was Alltel’s fixed line business and was spun off and subsequently merged with Valor Communications.  Below is a map of Windstream’s coverage area:
Windstream coverage

The company is better positioned compared to many of its rural ILEC peers.  Enterprise and small business customers make up more than 50% of revenue.  Fortunately, with landlines going the way of the dinosaur, broadband, both enterprise and consumer, makes up 73% of revenue.  Thus the company is somewhat shielded from the terrible economics of typical rural ILECs which are extremely reliant on residential landline customers that are increasingly disappearing.

Like most RLECs, it pays a hefty dividend of over 8% attracting unsophisticated investors.  The company caught my eye because it is spinning off its fixed line/fiber assets into a REIT, Communications Sales and Leasing (CSAL).  As part of the spinoff, the company is retaining 20% of CSAL.  For that reason, the effective dividend per share will decline from 70 cents a share to 58 cents a share, causing dividend investors to flee en-mass, even though intrinsic value will increase because of the tax savings.  In fact, since the spinoff (and dividend cut) announcement, the stock has declined 20%, which is unusual, since it is well documented that spinoffs tend to generate positive alpha.  Contrast that to Tony Thomas, the CEO, who seems to believe in the spinoff, as he bought 25,000 shares at 7.50 a share in late March.


Spinoff

After the spinoff, Windstream will lease the assets back from CSAL.  It will be the first REIT of its kind (broadband and fixed line asset REIT).  However other REITs share some similarities with CSAL.  Tower REITs, like American Tower (AMT) and Crown Communications International (CCI) have similar economics.  Tower REITs are REITs that control telecom infrastructure (mainly cell towers), which have generally high capital costs making barriers to entry from new entrants relatively high.  Thus, just like with Windstream’s fixed line assets, there typically are only 2-3 companies with telecom assets in one area.  While this advantage is increasingly eroding (which generally makes RLECs not very good businesses), this oligopoly like nature of the market is even more evident in the rural areas where costs may hardly justify even one entrant, thereby sometimes even requiring government subsidies.  For this reason, while they own slightly different assets, Tower REITs and CSAL share very similar economics.  Fiber, though, is even more capital-intensive than cell towers, perhaps providing a more significant moat, but also requiring more significant expenditures.

CSAL will lease out the telecom assets to Windstream.  The lease is for 15 years, with the option for WIN to extend it to 20.  The lease is triple net, meaning that the Windstream pays the cost of all expenses.  Typically triple net leases are for buildings, where no real capital expenditure is necessary to keep up the asset, however CSAL’s assets are fiber and fixed line assets who need regular capital expenditures to maintain the asset.  Windstream will be responsible for this as well.  While I only plan on holding WIN and CSAL for a year or two, this could cause problems as the lease nears expiry, as CSAL owns the assets giving WIN very little incentive to perform maintenance and capital expenditure which will keep the level of the assets similar to when it was spun off.  I do think this is a problem for the long-term, but if one is only holding for the spinoff, the problem will be masked and the price of CSAL will be bid up by generally unsophisticated dividend investors.


CSAL Valuation

CSAL will be paid 650 million dollars annually, and after three years, rent will increase by .5% per annum.  There is also a clause that allows WIN, if they extend the lease to 20 years, to force CSAL to pay up to 50 million per annum in capital expenditures, during the first five years.  In return rent will be increased by approximately 8.25% of total expenditures.  CSAL will also pay 50 million in capex this year.  All told, CSAL’s FFO will be around 422 million dollars a year, not taking into account the 50 million capex.

Windstream comps

I think the Triple-Net REIT peers are more appropriate than using the fiber companies.  The reason is because D&A is not a real cost so % of EBITDA that will go directly to stockholders for CSAL is more comparable to a Triple Net REIT than a fiber company that has lower % EBITDA economic earnings.  Interestingly, when I used the same comps set as management, I came up with an EV/EBITDA multiple of 18.5x rather than 13.9x (actually I used Unleveraged FFO which differs from EBITDA only in taxes paid which is relatively small for a REIT).  I don’t know how management came up with the 14x number, perhaps the triple net market went up in the corresponding three months, but according to my analysis of current multiple, that number is too low.  D&A isn’t a true expense for triple net REITs, and taxes are nearly non-existent.  For a REIT without economic depreciation expense, EBITDA is comparable to EBIT, and so the enterprise should trade at a comparable EBIT market multiple which is something around 18.2x.  Here is a list of the comps data that I created myself using managements selected triple net peer group:

Average Stats
MC 3942.4545
EV 5651.0909
MC/FFO 18.2x
EV/UFFO 18.5x
Debt/UFFO 5.4x


Another thing that is interesting to notice is that the price to FFO multiple is nearly the same as the EV to Unlevered FFO multiple.  This suggests that the cost of debt is a very good proxy for the cost of equity.  This makes sense because triple net leases are very safe and the risk profile and dividend payment is very bond-like.  Thus one can approximate the equity multiple by looking at the bond multiple.  According to CSAL’s 10-12b the weighted average interest rate is expected to be 5.9%.  The bond multiple would then be 16.9x.  Lowering the multiple by one, which is about the average difference, gives an implied equity multiple of 15.9x and a value of 6.7 billion dollars.

One can also look at cell tower REITs for a comparable for CSAL.  Tower REITs AMT and CCI, are trading at a MC to FFO multiple of 22.2 and 20.4 respectively.  EV/Unlevered FFO (basically EBITDA) is 24.2 and 28.4 respectively.  So it seems to me CSAL will trade at a premium of what management is even suggesting.  Now it sounds almost ridiculous that I’m projecting multiples higher than management—management being typically optimistic projectors—but the incentive structure that cause optimistic management projections (basically getting paid more for a higher stock price), gets flipped on its head for spinoffs.  Management typically is granted options which usually depend on the average price of the stock on the first few weeks of trading or so.  Thus, the more management lowers expectations, the cheaper the strike price of their options are.

CSALs net debt is right in line with its peers.  Actually so in line, that it suggests some intentionality by management.  Debt/UFFO (very similar to EBITDA) is 5.4x just like the peer average.  Taking the 18.5x EV multiple results in a market cap of about 8.5 billion.  Somewhat arbitrarily taking a discount of 10%, due to the unusual underlying asset and the fact that CSAL will only have one tenant, results in a market cap of about 7.6 billion dollars.  This is comparable to the implied equity multiple based on the bond rate.  The average of the two is 7.2 billion dollars.  Since WIN is only spinning off 80.1% of CSAL, the value to shareholders of the spinoff is 5.7 billion dollars.  Per share the value is 9.54 which by itself is 14% upside.

Let’s take a look at management’s presentation regarding the spinoff (pg 7):

Windstream Analysis


Windstream Parent Valuation

From CSAL, my valuation is about 30% higher than managements, as was said before.  However for the Windstream parent, my valuation is lower, mainly due to additional capital expenditures the parent needs to take on with regards to CSAL’s assets.  I don’t think management can use the average EBITDA multiple for ILECs to value Windstream like they do (see the slide above), because the company has to pay capital expenditures and maintenance for CSAL’s assets as well as their own assets.  Thus, capital expenditures to D&A ratio would be higher for WIN than the typical ILEC resulting in lower economic earnings.  For this reason in order the value WIN, I’m going to use a FCF multiple instead of an EBITDA multiple one typically uses for telecoms.

Income Statement    
For the Fiscal Period Ending 12 months
Dec-31-2014
Projection Dec 31 2015
Currency USD USD
Revenue                     5,829.5                     5,680.4
Other Revenue
  Total Revenue                     5,829.5                     5,680.4
Cost Of Goods Sold                     2,875.9                     2,783.4
  Gross Profit                     2,953.6                     2,897.0
Selling General & Admin Exp.                        983.8                        983.8
R & D Exp.
Depreciation & Amort.                     1,386.4                     1,039.4
Other Operating Expense/(Income)
Rental Expense                        650.0
  Other Operating Exp., Total                     2,370.2                     2,673.2
  Operating Income                        583.4                        223.8
Interest Expense                    (572.1)                    (342.5)
Interest and Invest. Income                            1.0                            1.0
  Net Interest Exp.                    (571.1)                     (341.5) 
Other Non-Operating Inc. (Exp.)                        (0.6)                               0
  EBT Excl. Unusual Items                          11.7                    (117.7) 
  Net Income                      (39.5)                     (117.7) 

As you can see, I am projecting net income to decline.  This is based on the fact that in most cases revenues for rural ILECs are declining at a small rate every year.  This is certainly true from WIN where revenues have declined from 6.1 billion to 6.0 billion to 5.8 billion, in 2012, 2013 and 2014 respectively.

Combining net income with D&A gets a good approximation of cash from operations before working capital movements.  For the cash flow analysis, I generally ignored changes in working capital, as cash from operations basically approximates net income plus D&A.  Initially, I used a regression to try to determine cash from operations.  However, cash from operations above and beyond net income + D&A was low quality, like change in pension expense and stock issuance, both of which are real expenses albeit non-cash ones.  Even though 2015 earnings is negative, free cash flow is still positive due to the difference between D&A and management guided capital expenditures.

Cash Flow    
For the Fiscal Period Ending 12 months
Dec-31-2014
Projection Dec 31 2015
Currency USD  
 
Net Income                      (39.5)                               (117.7) 
Depreciation & Amort.                     1,130.3
Amort. of Goodwill and Intangibles                        256.1
Depreciation & Amort., Total                     1,386.4                              1,039.4
  Cash from Ops.                     1,467.3                                 921.7
Capital Expenditure                    (786.5)                              (850.0)
  Free Cash Flow                        680.8                                   71.7

The reason for the massive decline in free cash flow for the WIN parent is due to the 650 million in additional rent payment the company has to pay, and declining revenues, offset somewhat by lower interest expense in the income statement.

I’m not all that positive on the parent.  While I still project it to be able to cover its dividend payment this year,  if revenue continues to decline, or capital expenditures continues to increase (which it might as CSAL is paying a one-time 50 million in WIN capex in 2015), then the company could start to become cash flow negative.  On the other hand, the parent holds a 19.9 precent stake in CSAL, and if it sells off that stake it will reduce interest payments by nearly 60 million or so, which will increase FCF by the same amount since D&A will shield the company’s economic earnings from taxes.    However, due to the lower earnings of the company, WIN will be extremely over-leveraged, with a Debt/Unlevered FCF ratio of around 12 (10 after selling CSAL shares).  WIN’s precarious position could be a problem for CSAL longer term, but if the catalyst is simply the spinoff and the value it will create, one should be protected buying Windstream, but has to be disciplined in selling both companies one year out if not earlier.

WIN parent is worth, at most, somewhere between 1-1.50 a share based on its 10 cent dividend, especially if they are able to keep the bondholders in check with the inflated EBITDA number.  Of course, it is very likely that investors could also drink the Cool-Aid that is management’s projections for the company.  Then the parent could be valued at somewhere between 4-8 dollars a share around the time of the spinoff, based on the ILEC EBITDA multiple in the slide above (pg 5 of this write up).  If the parent is valued at over 3 dollars, it is recommended that the parent be sold after the spinoff and only CSAL be held.


Monte Carlo Simulation

Having a good range of data, I can now create a Monte Carlo simulation for the stock price.  Here are the variables I used:

CSAL Valuation
cost of debt + premium method EV/UFFO multiple method
FFO 422.6 UFFO 647
Weighted Avg. Interest 5.90% Avg. EV/UFFO 18.5x
Stdev Interest Rate 1.28% Debt 3485
STDEV EV/UFFO Multiple 3.4x
WIN Valuation
Probability of low case 0.8 Probability of high case 0.2
Dividend 0.1 EBITDA 1263.2155
Avg. Dividend multiple 10.0x Avg. Multiple 6.1x
Standard Deviation 1.5x Standard Deviation 0.8x
Debt 5225.9

All random variables but one were normal, with the mean as the multiple (or interest rate) and the standard deviation as labeled.  Standard deviations were derived from the data.  For the cost of debt + premium method the multiple was derived from the interest rate, which was a normal random variable.  The only random variable that was not normal is the yes/no probability of low case or high case for the WIN parent evaluation.  The results of the simulation are as follows:

Windstream Monte Carlo

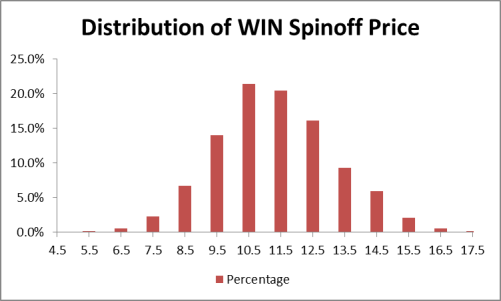
The probability of the price being higher than the current stock price of $8.30 is over 95%.  The mean value for the projected stock price is $11.31 and the standard deviation of the projected stock price is $1.91.   From the mean, the projected upside is about 37%.


Main Takeaway

Windstream is trading below intrinsic value due to the spinoff of its telecom assets into a REIT. The reason for this undervaluation is because the dividend will be cut, causing the retail investors, the main holders of Windstream’s stock up to recently, to flee.  Nevertheless, because of tax savings from the REIT conversion, and the parent’s wise choice to reduce leverage rather than pay an unsustainable dividend, intrinsic value is increased by the transaction.  Using a Monte Carlo simulation, the projected stock price is $11.31 for an upside of 37%.  This will be realized as the REIT is spun off and begins to trade in line with peers, as dividend investors seeing a stable and attractive higher yielding triple net REIT begin to bid up the price.  As with most undervalued stocks, this company is not without its risks.  WIN stream will be the only customer to CSAL, and Windstream, even after unloading debt and selling its share of CSAL, will be overleveraged, mainly because its spending will be enormous.  This is mitigated in the first year because CSAL will pay 50 million in Windstream capex.  There are also issues dealing with incentives for capex spending on WIN’s part regarding CSAL’s assets.  Both these issues should be hidden from the typical investor at least for the first couple of years, but the issues of the two companies will become more apparent down the road.  For this reason, I do not recommend holding for the long term.

Rightside Group (NAME)

Hi Everyone,

I’m sorry for not posting for so long.  I was working all summer and preoccupied with other stuff.  I wrote up a presentation on Rightside Group.  The presentation is very optimistic on the company and in reality I’m not so optimistic.  One of the reasons that I’m not as optimistic is that the registration rate for the gTLD (generic top level domains ie. like .com except with a different ending ie. .ninja) that Rightside owns are not all that popular and still in the tens and low hundreds compared to a projected downside case of 15k domain names registered in 2.5 years.  Doesn’t seem like a great downside case now does it…  A lot of people are really pumping the gTLDs, but who knows whether it will take off.  The registrar business is also still losing money and although it seems like any decent management should be able to turn it around (all the comps are profitable) they haven’t yet been able to do that.  If those two things don’t bother you you may like the pitch.  Link is here if you can read below.

Out of Mediterranean Oil and Gas (AIM:MOG)

I sold out of my position in Mediterranean Oil and Gas for a 20% gain a couple of weeks ago.  The BOD made a deal to sell themselves to Rockhopper Exploration for cash, stock and a contingent payment of 3.8 GBp based on success of the Hagar Qim.  There might be some opportunity for some merger arbitrage, as the stock is now trading at 6.50 GBp, valuing the deal only for the cash and stock component.  I’m not sure how to value the contingent payment, but assuming the probability of having commercially viable resources (the contingency the payment is based on) is the same as MOG’s third-party estimate of geological chance of success (12%) values the contingent payment at .41 pence.  I sold at higher levels, but at these prices I would just wait.  There might be a merger arbitrage opportunity here, but please do your own research before buying in as I read the terms of the purchase a couple of weeks ago and am just writing stuff down off of the top of my head.  I would have liked to have been able to sell out at a higher price as the stock is still probably undervalued at the purchase price, but at the same time oil and gas companies are not my specialty and I’m somewhat happy to be able to move capital to companies that I understand better.

Globus Maritime (GLBS)

I’ve looked at Globus Maritime (GLBS) and other dry bulkers a couple of times.  But the thread on Globus Maritime on Corner of Berkshire and Fairfax was what made me look into this company again.  I wrote up a powerpoint presentation.  One note however.  In the powerpoint I wrote that I calculated that the equity has a NPV of 46 million dollars assume the Baltic Dry Index doesn’t move.  That was with discounting the debt (plus interest) at 10% just like I discounted the cash flows.  If you don’t discount the debt and take it at face value, NAV comes to about 28 million dollars.  So perhaps there is some downside with this company and it depends how conservative you are looking at it.


Two Stocks that did not make the cut

Below I’ve written about two stocks I looked at that I did not like enough to add them in to my portfolio for reasons I will get into.  However maybe others will like to look at these stocks.  I should say, both of these ideas came from the value microcaps motherboard on Investor Hub.


Alloy Steel International (AYSI)

Alloy Steel International manufactures and distributes Arcoplate which is a wear resistant alloy overlay.  Wear is a big issue for mining companies that moves tons and tons of rocks, soil, and natural resources.  If a shovel or a truck bed is made out of metal, over time, rocks begin to chip away at the metal.  This makes the metal less useful and weaker.  Acroplate covers the metal in a carbide alloy that makes the metal stronger and less resistant to wear.  The company has patents for its products however it’s been selling its product for 20 years so it’s original patents must be running out.  The company has three patents (here, here and here (all courtesy of the investorhub page on AYSI)) The latest one is lapsed, so assuming this patent lasts 20 years, the second latest one filed in 1991 should be just about running out.

The company seems to have a decent amount of competition in this area.  Another company (note carbides group in the graph) assert that they have stronger alloys than Arcoplate.   This company is in the United States and Alloy Steel sells about 80+% of their product in Australia.  Arcoplate, though, is trying to expanding into North America.  Regardless, Arcoplate has been in the market for a long time and it is not surprising that others have found better ways to protect metal against wear.

In the attached Capital IQ income statement printout, you will notice that the company only started making money in 2007-2008 and then a lot of money in 2010 onward.  Much of this must be due to the commodities boom in Australia due to China development.  One risk is definitely what a Chinese slowdown will do the business.

The biggest risk with this company is organizational.  Since 2010, two CFO’s have resigned (here and here), at least one additional director and one CEO resigned after spending only a couple months at the company.  Something is obviously going on behind the scenes.  Perhaps it is a bad organizational environment (probably the best case scenario), but there are too many resignations for this just to be a coincidence.  The worst case scenario here is that fraud is going on.  I don’t think the company is entirely an illegitimate business mostly because the founder Gene Kostecki, has patents for the product and the company pays him a royalty of 1.5 million dollars a year.  Further, the company didn’t have problems retaining C level officers and directors prior to 2010 and the company did make money in 2007-2008.

The main reason to buy this company is the valuation.  The company has a market cap of 13.7 million dollars.  The company has about 7.8 million dollars in net cash.  The company earned 6.1 million dollars in the last 12 months and has averaged 4.5 million dollars over the last 5 years.  At the current market cap the company is trading at a P/E of about 2 and a P/E of less than 1 if you subtract out the cash.  If you buy the management and the legitimacy, this is an excellent investment.  Even though this is probably going to be a value trap as long as it can’t clear its reputation up, this company is easily worth 5 times what it is trading for, if it can remove the cloud of resignations surrounding the company.  Even a holding period of 8 years will generate returns above 20% if it reaches its conservative valuation.

Perhaps this company is a favorable risk and reward considering everything.  There is only a 100% loss in one direction but a 400% gain in the other.  Even if the chance of fraud is 50%, this still could be a good investment if in the case the company is not a fraud, it’s value is reached in at most 3-4 years.


Paul Mueller Co.  (MUEL)

Paul Mueller makes stainless steel tanks and vats for the diary, pharmaceuticals, chemicals, and water industries.  For MUEL, gross margins have been trending upward the past couple years and the question is whether the company has undergone a fundamental transformation or if the earnings growth is one time/cyclical.  I attached a copy of the fundamentals from Cap IQ for anyone that wants to look further.  I tried asking the company about their gross margin trends but they haven’t got back to me yet.

Since the company booked a one time gain on income taxes, I’m going to take pretax income and apply my own tax rate.  Since 2000, the company has averaged 3.3 million dollars of pretax income a year.  This year the company earned 13.2 million pretax.  If we take a tax rate of 35% we get 8.5 million dollars this year versus 2.1 million dollars for the average earnings.  Furthermore, earnings in the fourth quarter came in pretax at about 5 million dollars.  Post tax that comes to 3.5 million dollars or a 14 million dollar run rate.  The company also currently has backlogs (pg . 1) that are on par with its backlogs last year.  Has the company changed?  I don’t know.  The company is currently valued at 54.5 million dollars, with 8 million in net debt, so if it has fundamentally changed, you are getting in at a cheap valuation.

I was reading Thinking Fast and Slow by Daniel Kahneman and one of the themes of his book was how humans typically ignore base rates and base probabilities when considering decisions. We tend to think that every case is unique and the probabilities of similar events happening in the past have less predictive power than what is actually true.  One of the ways I thought I could apply this and use base rates to evaluate my investment decisions is to back test more.  I’m very surprised that people don’t talk about backtesting companies that fit the mold of the company one is interested in investing.  I can only assume, knowing whether the company you are investing in should be predicted to generate returns of 10% or 20% or 30%  would be enormously helpful in perfecting an investment strategy.  Obviously some plays are difficult to apply back testing.  David Einhorn’s market consolidation play comes to mind.  Unless Bloomberg or any other backtester has a number of competitors function, you are pretty much out of luck.  However, Paul Mueller fits the profile of a turnaround and we can easily set conditions that mimic what MUEL investors are facing.  The company has basically been unprofitable since about a year ago.  And now it is extremely profitable and trading at a P/E of around 5.  I can test how companies do, that fit Paul Mueller’s criteria.

I used Bloomberg’s Backtester.    I only looked at US and Canadian companies.  I looked at companies that weren’t profitable a year ago (almost but not exactly MUEL situation) but were trading at a P/E of under 6 in the current year.  The results showed that buying these types of companies yielded excess returns over the S&P 500 of 7.88% a year.  However, if you look at the graphs most of the excess returns come from cyclical companies profiting from an upswing of a cycle.  However, Mueller isn’t benefiting from an inflection point in the economy, the economy has turned for the better a couple years ago.  If we are going to profit from Mueller, it is because it is a company that is in a secular transformation.  If I take out the years where the economy was at an inflection point and a lot of cyclical companies were probably at the cusp of earning a lot more money, I find that this strategy hardly yields an excess return.   Too be honest, I’m not sure whether to keep in the inflection point’s data or not.  This year is certainly not an inflection point year where the economy improving is a huge tailwind, however on the other hand Mueller seems to be benefiting from stronger economic tailwinds.

Basically I don’t quite buy the secular transformation of this company.  Backtesting somewhat confirms my thesis; buying cheap companies that seem like they are undervalued and on the cusp of a secular transformation is a relatively bad strategy especially when the economic tailwinds and turning points aren’t really present.  However there is an argument to be made that Mueller will be revalued on cyclical upswing (however I think that is the market overvaluing a cyclical stock, however even if the market overvalues a company, if it goes up and you sell, you make money and the trick is getting out before a recession).

That about sums it up for today…

Note: I reserve the right to trade in and out of any stock mentioned.


Ophir Energy (LON: OPHR)

Although typically I try and stick to small cap companies in more familiar industries, Ophir Energy presents a proposition which is hard to ignore.  Even though this company is big, it really doesn’t have any proven reserves which is a bit disconcerting, which also makes it more difficult to analyze because who knows what contingent reserves will become probable and there are quite a few oil and gas companies that prey on investors high hopes for contingent and prospective reserves.

From just cursory research, there were a few fundamentals which caught my eye.

A couple of days ago Ophir announced that they sold a 20% interest in blocks 1, 3, and 4 in their Tanzania joint venture for $1.2 billion (1 billion after tax).   The company held 40% of blocks 1, 3, and 4 before the sale (from annual report), which suggests that they have 1 billion in cash and 1 billion in property (after tax) after the sale.  The Tanzania joint venture accounts for about 1 billion boe of their 3.7 billion boe of contingent and prospective reserves.  Tanzania as a whole, including the joint venture as well as other onshore properties, only accounts for 17,600 square kilometers, of their 106,700 square kilometers of total assets.  Most likely, (I haven’t done that much digging) the Tanzania property accounts for a lot of the value of the company.   The value of the joint venture ($2 billion dollars) plus the company’s net cash (225 million dollars) already nearly equals the market cap of the company (1.4 billion pounds).  All the rest of the assets, and there seems like quite a lot of it, is for free.

Note: I may enter and exit positions including Ophir at any time

Hyundai Motors Preferred Shares (KRX:005385)

There are a lot of cheap preferred shares in Korea. Preferred shares in Korea are different than in the US. In South Korea, most preferred shares are entitled to the same or higher dividend then the common, and have equal liquidation preference. Most preferred are also entitled to the same premium as the common, if they are bought out. The main drawback is that they don’t have any voting rights. That being said, the one drawback doesn’t justify a 50-60% discount many preferred trade at compared to the common shares. For the small shareholder, especially in a Korean chaebols with large and perhaps majority owners, voting rights will make little difference and is probably worth at most 10% the price of the stock. In summary, I think if one knows Korean it would be interesting to look into these preferred shares. It might also be interesting to buy a basket of these stocks at low prices like what Mohnish Pabrai and others have done with Japanese net-nets. Others have noticed this mispricing.  Weiss Asset Management has started a Korean fund focusing mainly on preferred stock. That being said, because I don’t know Korean, I will be looking into the only cheap preferred stock that I know that has English reports, Hyundai Motors, to give a rough indication of the cheapness in this sector.

Hyundai is a Korean car company. The company was split off from its parent, Hyundai group, in the East Asian Financial crisis. In 2012 the company sold almost 4.5 million cars (7.12 million if we include Kia) and is the 8th largest automaker. The company has about a 43% market share in Korea and owns 34% of Kia which has 31% of the remaining market share in Korea. A little less than half of Hyundai’s revenue comes from Korea, the rest comes from the US, Europe and China. Hyundai earned 8.5 trillion won last year. In regards to EPS, the company calculated 31,515 won per share taking into account both the common and the preferred shares.  The series 1 preferred shares entitles one to a dividend that is 50 won higher than the common shares, which even lends more credence to the idea that the preferred should be within 10% or higher of the common shares.

Margins shot up after the great recession to levels that the company has never seen before. Like I say later, despite never being at these levels before, these margins are probably indicative of the productive part of the business cycle, but will be attainable as the cycle continues it’s upturn and when the next cycle comes around. Margins are also helped by the dominant position of Hyundai Kia Motor Group in the Korean market.  The increase in margins helped push ROE up, which worries me as they will probably significantly deteriorate during the next downturn. The Korean equity market is equally worried, placing only an 8 multiple on the stock (price: 238500 won). The preferred trade at 4.4 times earnings (price: 13550 won). Assuming a 10% discount for the preferreds, implies a 53% upside. Even if ROI returned to a 6% which is the 13 year average, the preferreds would still be earning 16,000 per share and have a P/E of 8.5. That being said, I think that the quality of the business from an ROI standpoint has probably improved as the company increased in size, as even in good times (2004-2006) the company was only earning ROI’s of 6%. I feel like this is a heads I win, tails I don’t lose situation.

Compared to US companies, Hyundai ROE numbers aren’t comparatively high. GM had an ROE of 11% and just 2 years ago had an ROE of over 20%. Ford has an ROE of over 33%. Of course, US car companies are probably in the more productive part of the business cycle, however it’s not like Hyundai’s earnings are not so elevated that they couldn’t hold for another couple years. This is a short term play (1-2 years). If the business cycle holds up, this stock is worth 50% more than where it’s trading at (at the very least). If the business cycle does not hold up, the company is still trading at 8 times a conservative normalization of earnings.
-I am currently not long any stock mentioned but I might  take a position at any time.

Note: I have uploaded a write-up to drop box which has additional materials.

A-Mark (AMRK) and Spectrum Group (SPGZ)

All of this comes courtesy of otcadventures.  I really didn’t add any value on this one but I did do a short write up for my friend so I thought I would post it.

A-Mark Precious Metals is a company that is a middle man between mints (like the US Mint, the South African Mint, etc.) that sell gold/silver bars and coins to dealers and other retail stores.  The company is somewhat insulated from gold price swings as it collects a markup on the things it sells and hedges out gold prices for its inventory.  The company is counter cyclical and when the economy as a whole does poorly more people want to invest in gold and buy from A-Mark.  Its earnings and revenue over the last five years have looked like this:

earnings

The company generates respectable ROE and ROI at 22% and 15% respectively.  I consider these metrics less important because I’m not buying the company for growth and compounding of capital.  In the same vein, capex has been around 500000 the past three years, which hardly matters.  This company is an earnings play.  As such, A-Mark is a decent company.  Earnings have been positive the past five years and revenues have grown significantly (although earnings have not).  The company does not invest in commodities; it just acts as a middleman and profits regardless of the price of gold and silver. 

Spectrum Group is spinning off A-Mark and then reverse splitting and delisting.  Holders of Spectrum Group shares will get 1 share of A-Mark for every four shares of Spectrum Group.  Then Spectrum will undergo a 1000-1 reverse split.  All fractional shares would be cashed out at .65 a pre-split share.  Herein lies the opportunity to buy A-Mark.

Currently A-Mark is subsidizing Spectrum Group’s money losing collectibles division.  Therefore the reported earnings of Spectrum group are only a fraction of A-Mark’s true earnings power.  Here is the collectables group’s earnings: (next page)

collectables

(from otcadventures)

The earnings are horrendous.  These earnings are hiding A-Mark’s exemplary earnings and the company is only trading at a 87 million dollar market cap (and a 2.80 share price).  At A-Mark’s 11.8 million dollar earnings, the company is trading at a 7.3 multiple, assigning nothing to the money losing collectibles business. 

The money losing collectables business should be worth something.  Here is a look at their balance sheet.

collectables balance sheet

Valuing them at NCAV makes the parent worth 9.5 million.  That’s also about 1/3 of tangible book value, so it is very conservative.  Taking out 9.5 million from the 87 million market cap leaves A-Mark trading at 6.6 times average earnings over 5 years.  For the small shareholder, that gets cashed out at .65 a share, A-Mark is valued at 6 times earnings.

The one complaint that I have with the company is that the named officers get paid an obscene amount for a company of its size.  Here is the incentive pay for the CEO.

bonus

That comes out to about 2-3 million a year in incentive pay for CEO of a 70 million dollar company.  The CEO also gets paid a base salary of 525,000. The COO also got paid over 1 million dollars last year.

Long SPGZ